
Last week, I was talking with another DBA on my team about our release process. He was running a series of SQL scripts as part of a code release. There were about 4 different scripts and, while he was running each one, he would log the start and stop time for each script execution in a text file. We both recognized this as a perfect opportunity for some Powershell automation and I figured I’d put something together.
The pattern for logging this kind of work isn’t terribly complex. We have about 3 steps:
- Record the start time
- Execute the SQL command or script
- Record the end time
The simplest way to express this in Powershell-ese would be:
$StartTime = Get-Date
Invoke-SqlCmd -ServerInstance localhost -Database YourDB -InputFile ‘.\YourSQLFile.sql’
$EndTime = Get-Date
$Duration = New-TimeSpan -Start $StartTime -End $EndTime
Simple, effective, and can then be recorded to any desired output, such as a text file or a database table. Why stop here? Whenever we build automation, we should focus on flexibility and doing the work up front. So let’s enhance this.
If you’ve been reading my blog, you’ve probably noticed that I like to make use of custom Powershell objects for reporting. Custom objects give you a flexible and effective way to generate output, as it allows you to present your results in a variety of ways. With this in mind, I put together the following wrapper function to take either a SQL command or script, execute that command or script, and capture the relevant data about the execution.
function Measure-SqlCmd{
   param($instancename
       ,$databasename = 'tempdb'
       ,[Parameter(ParameterSetName = 'SQLCmd',Mandatory=$true)]$Query
       ,[Parameter(ParameterSetName = 'SQLScript',Mandatory=$true)]$InputFile)

   $output = New-Object System.Object
   $errval = $null

   $output | Add-Member -Type NoteProperty -Name InstanceName -Value $instancename
   $output | Add-Member -Type NoteProperty -Name DatabaseName -Value $databasename
   $output | Add-Member -Type NoteProperty -Name StartTime -Value (Get-Date)

   if($sqlscript){
       $output | Add-Member -Type NoteProperty -Name SQL -Value $sqlscript
       $sqlout = Invoke-Sqlcmd -ServerInstance $instancename -Database $databasename -InputFile $InputFile -ErrorVariable errval
   }
   else{
       $output | Add-Member -Type NoteProperty -Name SQL -Value $sqlcmd
       $sqlout = Invoke-Sqlcmd -ServerInstance $instancename -Database $databasename -Query $Query -ErrorVariable errval
   }

   $output | Add-Member -Type NoteProperty -Name EndTime -Value (Get-Date)
   $output | Add-Member -Type NoteProperty -Name RunDuration -Value (New-TimeSpan -Start $output.StartTime -End $output.EndTime)
   $output | Add-Member -Type NoteProperty -Name Results -Value $sqlout
   $output | Add-Member -Type NoteProperty -Name Error -Value $errval

   return $output

}
At the core, we’re using the same pattern as declared above, but we’re just capturing other pieces of data and putting them into the properties of our custom object. This allows us to do all sorts of stuff. Let’s start with simply running our function:
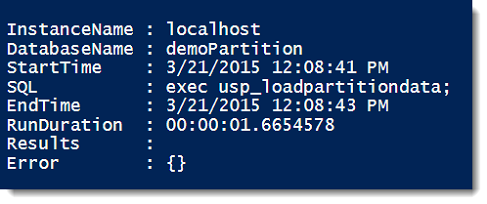
Measure-SqlCmd -instancename 'localhost' -databasename 'demoPartition' -Query 'exec usp_loadpartitiondata;'
The results are a nice little object list, giving us the information about our SQL command:
Handy, no? Well, now the fun begins. Let’s say we have a couple commands to execute and we want to output this to a comma separated values(.csv) file for logging. Because we did all the work upfront of making a function and the custom object, the rest becomes a snap:
$total = @()
$total += Measure-SqlCmd -instancename 'localhost' -databasename 'demoPartition' -Query 'exec usp_loadpartitiondata;'
$total += Measure-SqlCmd -instancename 'localhost' -databasename 'demoPartition' -Query 'exec usp_fragmentpartition;'
$total | Select-Object InstanceName,DatabaseName,StartTime,EndTime,SQL,RunDuration | Export-Csv -Path 'C:\Temp\ExecutionLog.csv' -NoTypeInformation
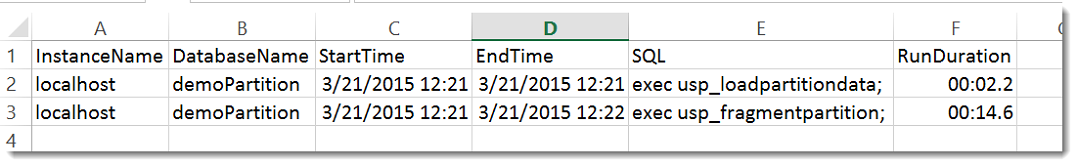
The bonus of using this pattern is I can use the object collection for a variety of reporting methods. Using Export-Csv, I can easily create my .csv log file. Another option is to use Chad Miller’s(@cmille19) Out-DataTable and Write-DataTable to record this info to a database table. We now have a flexible logging process to work with.
We also go back to the principle of tool building. Here’s a tool for SQL execution that I can use to give me a repeatable logging process. As I continue to say, automation is about consistency. We can use this logging method to automate SQL script and command executions across multiple instances, track them all in the same way, and then store or handle this appropriate to our process. The end result is tracking our work the same way, every time.


 I’m tweeting!