
When working with databases, the question of performance always comes up. Whether it’s a new build or an existing setup, we need some sort of radar gun to measure our instances to make sure they’re up to snuff. The idea is simple: We need some sort of benchmark that tells us, at least in a relative sense, how well our systems are performing.
Of course, the tools and approaches available to us seem as numerous as stars in the sky. Want to measure storage performance? Take a look at SQLIO or IOmeter. Need a full end testing suite? Paid tools like LoadRunner and Benchmark Factory can help you. Anything else? A quick Google search will provide plenty of options. So where do you start?
For my part, I have become a big fan of HammerDB. Discovered via Kendra Little(@Kendra_Little), HammerDB is a handy tool that allows you to run a TPC-C benchmark against your instances(and not just SQL Server!). You can specify several different factors to customize your testing, yet the tool has an easy to use interface. It’s also very well documented, with some good instruction on how to set up your own load tests.
While the HammerDB documentation and Kendra’s post are fairly comprehensive, I did want to share a little on how I setup and run my own HammerDB tests. This is mostly because there’s a couple gotchas that aren’t covered (after all, the guy who wrote it is an Oracle dude, so I’ll cut him some slack). First off, let’s talk about the initial schema build. We can let HammerDB create everything from scratch, but because it uses all of SQL Server’s defaults for that, we get a poorly configured database. When I am setting up a test (approximately 100 warehouses), I will specifically create an empty database with my files right-sized and in SIMPLE mode, and then use HammerDB to create the schema within that database:
create database tpcc
on primary (name=tpcc_data01, filename='c:\dbdata\tpcc_data01.mdf',size=10gb,maxsize=unlimited,filegrowth=1gb)
log on (name=tpcc_log, filename='c:\dbdata\tpcc_log.ldf',size=4gb,maxsize=unlimited,filegrowth=1gb);

alter database tpcc set recovery simple;
I use SIMPLE mode primarily so I don’t have to bother with log backups on the benchmark database. Keep in mind this doesn’t actually affect how transactions are processed, only on how they’re removed from the log file. By properly sizing the log file, we avoid messing around with too many VLFs, which could adversely affect our numbers.
At this point, I’ll kick off the schema build, usually with 10 concurrent users. It still could take a while to build, so patience is key. I have had issues where the tool sometimes flubs on finalizing the schema (when creating the indexes and stored procedures), so if you run into that you can find them in a SQL script here.
Once the schema is in place, it’s a simple matter to run the test. We can run an ad hoc test easily enough, but for a solid benchmark we need use HammerDB’s autopilot functionality. The autopilot will run sequential timed tests using different concurrent user threads to iteratively increase the load.
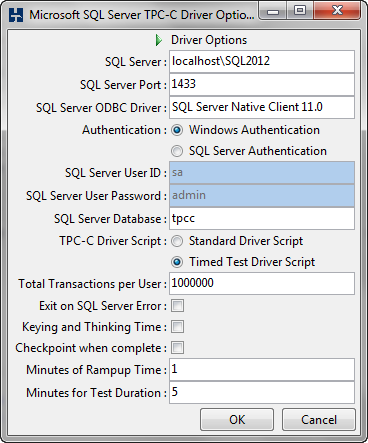
First thing to do is make sure, under the Driver Script options, we’ve selected “Timed Test Driver Script”. Then I tweak a couple things here, mostly around the length of each test. HammerDB defaults to a ramp up time of 2 minutes, followed by a 5 minute test. Keep in mind that having a ramp up time is very important, because it allows the system to “warm the cache” and give you more consistent numbers. That being said, I adjust these values, going with a ramp up of 1 minute and a 5 minute test. Our schema is not tremendously big (10 GB), so this is usually enough. It doesn’t hurt to have larger values if you want, but 1 and 5 suit my purposes. Once this is all set, I load the script and I’m ready to move on to the autopilot settings.
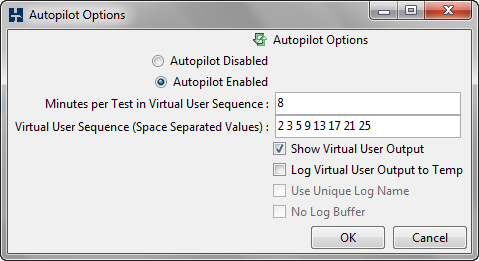 Next, I need to enable the autopilot. I’ll leave the concurrent user batches at their defaults, as they give you a nice battery of threads for usage. However, this is where the first gotcha is. When setting the time for each test, this has to exceed the total of the ramp up time and the test time, plus some time for setting up and tearing down each test. Since I go with settings that give me a total of 6 minutes for a single test run, I’ll set the test time in the autopilot settings to 8 minutes to give the application time to do all the other setup work it needs. Having this buffer time doesn’t affect anything with the test itself, but if you cut it to short, the application will essentially discard your results to move on to the next test. As a nicety, I like to check “Show Virtual User Output” so I can sanity check that everything is running ok during the test. The info isn’t very informative (like watching the Matrix code), but you’ll at least see errors in the run.
For the tests themselves, I’ll actually run the full autopilot test batch three different times. I should get results that are relatively the same, but I do want to measure for consistency. Then I chart out the results, looking at three numbers:
- Concurrent users (note this is the number in HammerDB minus 1, because HammerDB has one user acting as a controller)
- Transactions Per Minute (TPM)
- Transactions Per Minute Per User (TPM/Concurrent Users)
Naturally, we should see the TPM increase as the number of connections rise. What I’m particularly looking for is to see the behavior curve for TPM/user, which should remain steady.
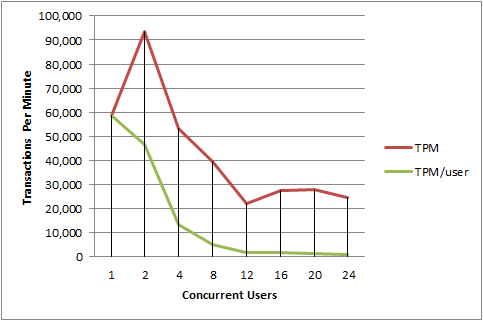 If we take a look at this sample from a run on my laptop, you can see what I mean. It is, of course, not a “good” thing that the average TPM/user drops as connections increase, but this is expected as my poor little laptop isn’t made for enterprise OLTP. We can at least see that my laptop could handle two concurrent users before falling over on its face.
Some final caveats to keep in mind. The first is to remember that these numbers are relative. There’s no “good” value for this, it’s all related to how your systems are performing. The second caveat is that this is an unofficial TPC-C result. Vendors and the TPC will only certify something as official under very controlled circumstances, mostly because it’s their reputation on the line. Finally, these values shouldn’t stand in a vacuum, but measure them alongside other metrics (i.e. CPU, Page Life Expectancy, etc).
That being said, I find HammerDB an effective tool for giving me a general idea of system performance, using a standard that is application agnostic, thorough, and has a proven track record.

 I’m tweeting!