Art of the DBA Rotating Header Image

Monitoring

The Hierarchy of Monitoring Needs

For those not aware, I’ve been selected as a presenter at this year’s PASS Summit in Charlotte, NC.  I’m deeply honored by the selection and look forward to the experience.  The topic is something I’ve been working on for sometime now:  How should administrators approach monitoring?  This seems like a simple question, but go Bingle “SQL Server Monitoring” and see what you get.  Go ahead, I’ll wait.

The results are either tools or metrics.  While these are useful, it highlights a significant gap out there: a methodology.  The closest you’ll find out there is Adam Machanic’s (@adammachanic) Ten Commandments Of SQL Server Monitoring (which applies to all monitoring, really, but I digress).  The goal with my PASS presentation is to provide a “how to” plan for creating your overall monitoring strategy.

Hierarchy of Monitoring Needs

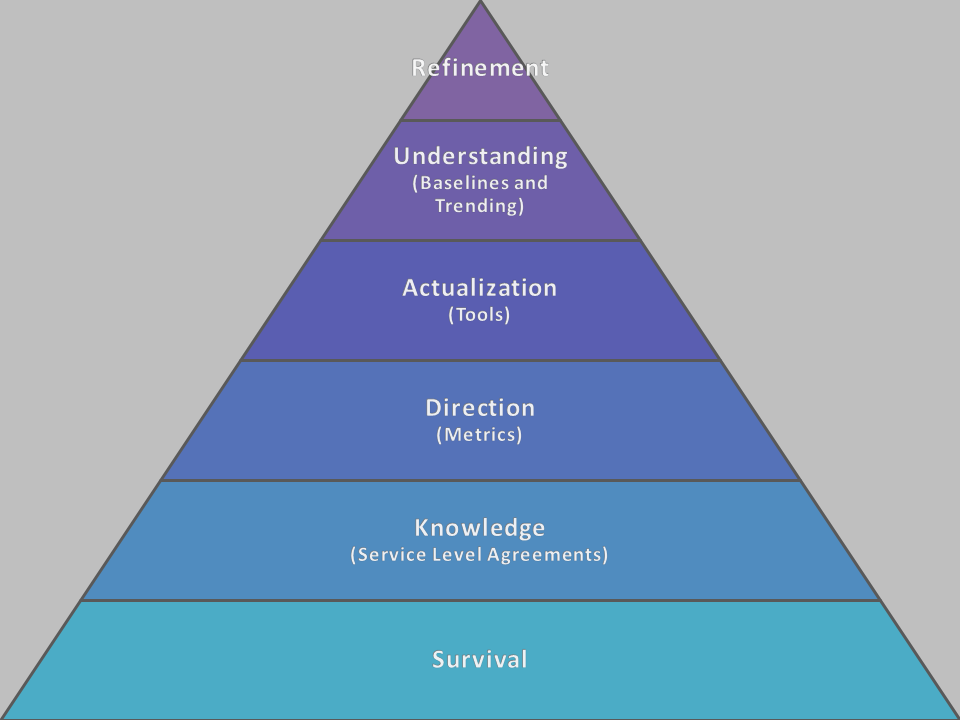
How does this methodology work?  Several years ago I was introduced to Maslow’s Hierarchy of Needs.  It’s a structured view of what humans need, built around a tiered view where a person addresses each level before they are concerned with the next set of needs.  The template carries well, such that Brent Ozar(@brento) even wrote about his own Hierarchy of Database Needs a while back.

So what’s my approach?  To get the detail, you’ll need to come to my PASS session, but I’ll let the overview whet your appetite:

Survival – There are some factors database administrators must be concerned with.  As guardians of the data, we have to ensure three things about our systems before we can worry about anything else:

    • Reliable backups – You hear this ad nauseum, but it’s true.  Without backups, we’re crossing the high wire without a net.  Note, also, that these are “reliable”.  You need to know more than your backups are happening, but can you find them and are they usable.
    • Service Availability – Is SQL Server up?  Is it responding to queries?  While this seems like a “duh” moment, if our users can’t access their data, then we’re in almost as much trouble as we were if we can’t recover from a backup.
    • Space – This is not long range capacity planning that we will worry about later down the road, but a validation that we’re not “red lined” for space.  Because if we run out of space, we affect availability and use of our databases.

Knowledge  – In order to identify what to monitor, we need to know what to be monitoring for, otherwise we’re wandering in the mountains without a map.  We establish this by working with the business to create our Service Level Agreements.  I wrote about SLAs a year ago and my approach is still the same:

    • Availability – Users want to know their data is queryable, protected, and secure.  We need to define our customer’s expectations for high availability, disaster protection, maintenance windows, and security.
    • Performance – Users want their data fast, but we need to put definition around this.  What defines a query as to slow?  How long can things be blocked? What sort of resource usage is allowed within our environments?
    • Support – While this only partially affects our monitoring, our users want to know who’s “throat to choke” if there’s an issue.  For monitoring, that defines escalation patterns and critical/non-critical alerts.

Direction – Metrics and whether they’re to high or to low are commonly what DBAs think of when they discuss monitoring.  Are my batches/second to high?  What’s my I/O throughput?  Page Life Expectancy? Wait types? The list goes on and on.  However, like many things, DBAs want to put the cart before the horse and just start looking at stats.  By dealing with SLAs first, we’ll be better equipped to monitor what’s important to the business rather than what’s important to us.

Actualization – After we know what to look for, it’s time to decide how we look for it, and this leads us into the discussion of tools.  The problem is, there are a load of tools out there you can use.  Do you go with a specialized third product?  Maybe some larger, more generic system that integrates with other parts of the enterprise?  Do you write your own, using what’s freely available and paying the cost in time to build?  Whatever the case, having a list of metric needs equips us with the knowledge necessary to identify what tool set best suits our situation.

Understanding – One of the trickiest parts of monitoring is knowing what’s a problem and what is just normal behavior.  Once our metrics are defined and our tools are set up, we need to collect baselines and map trends to understand the health of our enterprise.  While our SLAs can give us a starting point, we need to study our environments over time.

Refinement – Once everything is in place, we can start the cycle of fine tuning our monitoring.  Systems and processes change over time.  New storage will need to be added and new applications brought on line.  With we are able to periodically review our trends and anticipate future needs.  Managing our metrics based on these changes and adapting our monitoring is an ongoing process and is never set in stone.

Just so you know, this is just the 30,000 foot view that gives administrators the basic map.   At Summit I’ll discuss the territory in a little more detail as well as some scripts, templates, and additional information to help you with your own monitoring needs.  I’m very excited to be sharing this at Summit and hope that you’ll all join me for it.

Server Inventories

Ok, I’ve been promising this to people for a while, time to get at it.  Brace yourself for a long one.

 As enterprise DBA’s, we usually have many servers to manage.  Whether it’s around ten, a hundred, or a thousand (or more!), tracking this manually is a bear.  However, there are still many shops maintain convoluted spreadsheets and other manual documentation to track their inventory.  Manual sucks.  As John Sansom(@SQLBrit) says, the best DBAs automate everything, including their server inventories.

 There’s a lot of approaches and third party tools you can use for your own environment.  In my mind, I’m totally cool with spending the money on a third party tool because of the depth they can provide in my tracking and monitoring.  A lot of times, though, we might not have access to those tools or we may need more information than those tools provide.  It’s at this point we sit down at our keyboard, crack our fingers, and start banging out some code.  Of course, the code I started banging out was Powershell (shocking, I know!).

 I didn’t start from scratch, though.  When putting my own script together (which we’ll get to later), I found two great resources that got me about 80% of the way:

 Allen White(@SQLRunr) – Let PowerShell do an Inventory of your Servers
Colleen Morrow(@ClevelandDBA) – Building A SQL Server Inventory

These are both great resources that will get you started, but I needed a little more.  The biggest challenge I had was a need to poll cluster information and collect SQL instance information separate from my machine information.  I also wanted to do some consolidation of my data sets.  So while I borrowed heavily from both Allen and Colleen, but then molded it to my own purposes.

Process

Before we dig into the code, I first want to touch on the collection process and how I handle it.  It’s not complex, but code doesn’t make sense until you understand the “why” of the different components.

What I’m collecting

  • SQL Instance information – Whether it’s an instance living on a cluster node, a physical stand alone, or a VM host, I want the SQL Instance without really caring about the machine it lives on.  At least not meshed in directly with the machine, though I DO collect the physical host name so I can identify which machine information I need.

  • Physical Machine information – Since I’m not tying the machine info directly with the SQL Instance collection, I want the physical information for the servers my instances live on.  This is where I get everything that isn’t tied directly to the SQL Instance.

How I’m collecting it

  • I’ve got 4 tables, 2 live tables and 2 stage tables, that I use for the collection.  Nothing out of the ordinary, but there’s an instance table with a stage table and a machine table with a stage table.

  • I use a Powershell script to perform the collection itself.  It uses instance table as its primary driver, where the idea is that I provide the initial population of instance names to track into the table and the inventory process will fully populate the rest of the information.

  • When the Powershell scripts complete, there is a stored procedure it executes to load data from the stage tables into the live tables.  The load is simple, where the instance table is updated with data from the stage and the machine information is deleted/replaced.

  • The Powershell script is run by a SQL Agent job running under a specific monitoring Active Directory account created as a credential in SQL Server.  The gotcha here is that the monitoring account needs domain access to the clusters and machines it’s going to be querying.

The Code

I won’t list the full scripts here, but you can download and review them here:

SQL Objects
Powershell script

 Let’s first talk about the dependencies:

  • The SMO, so you’re going to need to have either your script or your profile load the 2008 snap-ins or import the 2012 sqlps module.

  • Chad Miller’s Out-DataTable and Write-DataTable (I combined them into one file, DataTables.ps1).

  • The FailOverClusters module, part of the Remote Admin pack if you’re not running the code on a machine with the Windows Server OS, part of the Fail Over Cluster components if you are.

There are two key functions I use, Get-Instance to gather the SQL instance information and Get-Machine to gather the machine information:

#Collects and returns SQL Instance information
function Get-Instance([string]$instcoll,[int]$id,[string]$name)
{
try
{
	$smo = new-object ('Microsoft.SqlServer.Management.Smo.Server') $name
	$sname = $smo.NetName
	$iname = $smo.InstanceName
	if($iname.Length -eq 0 -or $iname -eq $null) { $iname = "MSSQLSERVER" }

	$managedcomp = new-object ('Microsoft.SqlServer.Management.Smo.WMI.ManagedComputer') $sname
	$output = New-Object System.Object

	$port = $managedcomp.ServerInstances[$iname].ServerProtocols["Tcp"].IPAddresses["IPAll"].IPAddressProperties["TcpPort"].Value
	$ip = (Test-Connection $sname -count 1).IPV4Address.ToString()

	$output | Add-Member -type NoteProperty -name InstanceId -value $id
	$output | Add-Member -type NoteProperty -name SQLVersion -value $smo.VersionString
	$output | Add-Member -type NoteProperty -name SQLVersionDesc -value $smo.ProductLevel
	$output | Add-Member -type NoteProperty -name SQLEdition -value $smo.Edition
	$output | Add-Member -type NoteProperty -name MemoryMinMB -value $smo.Configuration.MinServerMemory.RunValue
	$output | Add-Member -type NoteProperty -name MemoryMaxMB -value $smo.Configuration.MaxServerMemory.RunValue
	$output | Add-Member -type NoteProperty -name MAXDOPVal -value $smo.Configuration.MaxDegreeOfParallelism.RunValue
	$output | Add-Member -type NoteProperty -name IP -value $ip
	$output | Add-Member -type NoteProperty -name Port -value $port
	$output | Add-Member -type NoteProperty -name PhysicalHost -value $smo.ComputerNamePhysicalNetBIOS
	return $output
}
catch
{
	write-host "Error collecting $name"
	return $null
}
}#Get-Instance

#Get host machine information via WMI
function Get-Machine([string]$name,[string]$clst)
{
 try
{
	$comp = gwmi Win32_ComputerSystem -Computer $name | select Model,Manufacturer,TotalPhysicalMemory
	$proc = gwmi Win32_Processor -Computer $name | select NumberOfLogicalProcessors,MaxClockSpeed
	$os = gwmi Win32_OperatingSystem -Computer $name | select OSArchitecture,Name,Version,ServicePackMajorVersion,ServicePackMinorVersion

	$output = New-Object System.Object

	$output | Add-Member -type NoteProperty -name MachineName -value $name
	$output | Add-Member -type NoteProperty -name Model -value $comp.Model
	$output | Add-Member -type NoteProperty -name Manufacturer -value $comp.Manufacturer
	$output | Add-Member -type NoteProperty -name Architechture -value $os.OSArchitecture
	$output | Add-Member -type NoteProperty -name PhysicalCPUs -value $(if(!$proc.Length){"1"}else{$proc.Length})
	$output | Add-Member -type NoteProperty -name LogicalCPUs -value ($proc | Measure-Object NumberOfLogicalProcessors -sum).Sum
	$output | Add-Member -type NoteProperty -name CPUSpeed -value ($proc | Measure-Object MaxClockSpeed -max).Maximum
	$output | Add-Member -type NoteProperty -name MaxMemory -value ($comp.TotalPhysicalMemory/1MB)
	$output | Add-Member -type NoteProperty -name OSName -value $os.name.split("|")[0]
	$output | Add-Member -type NoteProperty -name OsVersion -value $os.Version
	$SPMaj = $os.ServicePackMajorVersion
	$SPMin = $os.ServicePackMinorVersion
	$output | Add-Member -type NoteProperty -name SPVersion -value "$SPMaj.$SPMin"
	$output | Add-Member -type NoteProperty -name Cluster -value $clst

	return $output
}
catch
{
	write-host "Error collecting $name"
	return $null
}
}#Get-Machine

Both leverage the SMO and the WMI to get relevant info.  I’ll let you sort through the individual elements I’m pulling, it’s fairly standard config info.  Data gathering, because I think in terms of tables, is a collection of objects that are essentially rows.  I append each new object with all the appropriate properties to a larger collection, then use Write-Datatable to push that data directly into the related stage table.

Look at the entire script for my full process.  I’ve been pretty happy with it and it’s been chugging away in my environments now for about 8-9 months without a whole lot of interaction from me.  If we stand up a new server, then I just pop that name in the instance table, run the job, and everything gets updated.  What made me most proud was that we had a recent meeting with a new VP and pulled up the SSRS report built off of this information to give him an idea of what our environments.  His comment was “This is the most documentation I’ve seen since I’ve got here.”  The beauty is that it was provided without a whole lot of manual maintenance on my part.

This is very much an evolving work on my part, but hopefully gives you some insight into how I manage my environments.  I’ve still got lots of ideas on improvements, including automatic population (or other use) of Central Management Server.  If you have any ideas on how this can be improved, I’d love to hear them.

Professionals have standards

A couple weeks ago I wrote about establishing Service Level Agreements (SLAs) before you actually start building out a monitoring solution for your environment. These SLAs help you define what you need to be monitoring and give yourself some control when dealing with the non-DBAs in the company. Now that these expectations have been set on service, your next step is to define the other side of the equation: What you should expect from the databases you must manage. After all, we can promise a level of service, but it’s difficult to meet that promise if there are underlying issues with a database. So now we need to define database standards.

Remember that SLAs are agreements, where both sides have come to an understanding about service expectations. Once we have these, we have to tell developers and third party solutions what is required of them so that we can meet these expectations. Do you want to be saddled with another poorly designed database or not have the hardware to support your transaction load? With a standards document, we can give our non-DBAs clear and certain documentation of what our systems should look like.

Feelings?

Just like many other things we do as DBAs, we know what a good database looks like. The problem is no one else does. Many developers don’t understand the impact of not having a clustered index or the value of defining foreign keys. Executives get confused by disk requirements or backup strategies. Often, because they don’t know what we know, decisions will be made without these considerations. By providing documented standards, the folks who don’t “get it” don’t have to, they can refer to the standards document. If they don’t, we have that document to show them why we can’t support an application the way they want.

Unfortunately, standards are a little harder to define because there are just so many things to go in to what makes a database. This is why we want to start with an SLA framework, so we have some targets to use for building these standards out. We also need an understanding of our environments and what sort of systems our business can and will support (after all, we can’t all get PDWs). The key is to start with what you know and, as you start to lay out these requirements, your standards will start to fall in to place. Consider these examples as bread crumbs to get you headed in the right direction:

  • Database file layouts: Require separation of your database files, so that you can have documentation to back up disk requests for servers.
  • Naming standards: Keep your developers from creating those pesky “sp_” stored procedures. Also, help keep things organized across your environments.
  • Archiving: While you may not be able to explicitly define an archiving strategy, by putting requirements on what kind of data retention you can support , you can proactively manage your disk usage and performance.
  • Indexing strategy: Keep those heap tables from cluttering your database as well as provide guidelines to your developers so that they don’t over-index.

Keep in mind this is not anywhere close to an exhaustive list of what you can build standards on. It will probably take you a fair amount of work to construct your standards document, but it is effort well spent. Remember that you’re not only trying to educate the non-DBAs in your company, but providing a safety net as well for yourself.

The difference is…

We all hate documentation. It is tedious work that keeps us away from all the fun stuff. A lot of times, it feels like wasted work because who reads it, right? The thing is, people will read your documentation, if you make it available. You read a lot of blogs? That’s just us, documenting. So if you create your SLAs and standards and publish them internally, people will pay attention. And if they don’t? Well, you will have a starting point when you say “no”. “Sorry, that design is not supported by our published standards,” has a lot more weight when you actually have published standards.

The developers, the executives…they just want things to work, but they won’t give you what you need unless they know what you need. It’s your job to be proactive and create these policies, because no one else will do it for you. You hear it a lot, how you should be a proactive DBA, not the one that’s always fighting fires, and to do that you need a plan. SLAs and standards, these are your plan, and I challenge you to start on them today so you can take back control of SQL Server and your DBA life.

P.S.  Thematic content for the post headings can be found here (PG-13ish).

Monitoring – Where to start?

It’s real easy in the tech industry to jump in and start slinging code or writing configs.  Most of us learn this way, throwing technological spaghetti up against the wall and seeing what stick.  It’s not what we want to do, though, when we’re looking to put something long lasting in place.  We need a plan for understanding and measuring the health of our SQL Servers, something we can take to the check writers to show them how we’re doing and give them measurable indicators of success.  This is where Service Level Agreements(SLAs) come in.

Ah, you were afraid I was going to say that?  I know for some people, “SLAs” is as bad as any other four letter word.  I hear it all the time “I’ve been doing for a long time, I know what I need to do.”  And it’s true, much of our work comes naturally: how much space do we have on disk, what’s our index fragmentation, is SQL Server up or down, etc.  The SLA, however, is what we can use to not only communicate to our users what we’re watching, but also help control things so we’re not waking up in the middle of the night because a developer dropped a table.

SQL Server high (level)

We need to keep in mind that most of our management doesn’t care about DBCC checks and backup strategies, they just want to know that the database is up and working.  We’ll take care of the details.  Our SLAs provide a framework that helps our users define operational standards without getting lost in the weeds.  My approach is to outline this by breaking my SLA structure into 3 general areas:

Availability: This is the easy one, are your databases or servers up and available?  When we define this SLA, we’re telling our users that their data will be available when they need it.  Some of the elements that fall under this are:

  • Is a database available 24/7 or only during business hours?
  • Do we need high availability?  What sort of service interruption can the database support?
  • In the event of a disaster, how much data will we lose (Recovery Point Objective) and how long will we be down (Recovery Time Objective)?
  • What sort of resource overhead, such as the free space on disk necessary keep the database up and running?
  • When will the database be down for maintenance and how long can that maintenance be?

Performance: Now we get into a little grey area, because we’re tell our users how well the system will perform.  It’s tough to put any parameters around “the database is slow”, but we can put some hard numbers around this, primarily by looking at the server health metrics.  Some things to consider are:

  • Acceptable query response times for standardized processes.
  • Thresholds for CPU, memory, and disk I/O.
  • Blocking process monitoring and resolution.
  • Index and Statistics maintenance.
  • Batch requests per second.

Support: And now it gets even fuzzier.  There’s always going to be drive-bys and break fix requests.  Whether or not you have a service ticket system or some other method for tracking database team requests, you’ll want to define your response and resolution times as well as work with your customers to determine what’s acceptable from a customer service perspective.  Also, if you have custom code or application procedures, you’ll probably want to have documented what level of response items like failed SQL job, ETL loads, and similar processes will get.

Not being all things

The next thing to define is your tiers of service.  Just like you shouldn’t be all things to all users, you won’t be able to support all your applications in the same way.  By defining your different application types, you can set reasonable expectations for your support.  This area is fairly open, because you might have only two types of applications, or you might have four or five.  A sample breakdown might look like this:

  • Critical 24X7 applications – Applications in this category must be up 24 hours a day, 7 days a week and be able to handle continuous transaction load.  Interruption or degradation of service is considered a priority and requires immediate response.
  • High demand business applications – Applications in this category need to be available 24 hours a day during the business week, midnight Monday to midnight Friday.  Interruption of service requires quick response.
  • Standard business applications – Applications in this category should be available during standard business hours, Monday through Friday.  Interruption of service should be limited during business hours.
  • Lower environments – All non-productions environments should be maintained and supported to allow development resources to be able to complete projects.  Downtime should be kept to a reasonable minimum during working hours.

Your tiers will likely be driven by availability needs first.  The key is being able to categorize your application needs so that you can respond appropriately.  This is also to protect you, because if you’re burned out trying to get development boxes taken care of, you won’t be able to handle things if that webserver handling your company’s sales goes down.

Agreeing on something

The key with creating these frameworks is to remember it’s an agreement between you and your users or customers.  You want to work with them to create reasonable expectations so that if something does go haywire, both sides will know how the issue will be handled and what sort of time frames are in place for resolution.

The other piece of this being an agreement is your users or customers will need to meet you part way.  If you have SLAs defined for a highly available 24X7 application, you want your developers to make sure that the application can meet those needs.  It’s key that your users understand their stake in providing good service, such as calling to report errors or ensuring that an application can handle a database failing underneath it.

It’s a start

I’ll be honest, I’m still working on fleshing much of the above out as I roll out an SLA framework at my company.  What you see here will undergo some tweaking and fine tuning over the next few months as I get some more definition around it, but the intent is to follow the basic structure I’ve laid out here.  There will be more specifics under each of the three areas that will be shared as they develop.  If you have anything to contribute or are curious about, please feel free to leave your input or questions in the comments and I will respond as I can.

Brushing up on your (backup) history

Backups are huge, right? As administrators, they should never be far from our minds. Backups are one of the cornerstones of disaster recovery and safeguarding our data. It only makes sense that we want to keep an eye on when backups happen and if they’re successful. Recently, I’ve been making a lot of use of a simple little query that shows me how my backups are doing:

SELECT
  database_name,
  type,
  max(backup_start_date) last_backup
FROM
  msdb.dbo.backupset
GROUP BY
  database_name,
  type

Yes, this is a VERY straightforward query, no hidden magic here. But with this one little SELECT statement, I have been able to quickly establish if my backups are getting run, what specific databases may have problems, and where I need to focus my troubleshooting. By breaking it down by database and type, I am also able determine whether or not my log backups are running (key to out of control log growth), if I’m properly maintaining my recovery chain, and what backups are going to be necessary to restore my database.

Unlocking the secrets

The key is the the backupset table in msdb. This table stores the history of all successful backup operations on the server(emphasis on successful). It’s not just native SQL backups, but those by third party tools as well, so we can have insight in to any backups (or lack of) that are happening. I first came across this table working with Brent Ozar’s(b|t) Blitz script. Brent introduces this query as part of his server take over to establish whether or not your backups are being taken, which is the primary reason I check it. Backing up our data is vital and not doing this would probably be an RGE. If nothing else, this table says “Hey dummy, I need you to look at something!”

If we dig in a little more, though, we can find other useful information. Take the backup_start_date and backup_finish_date fields. By using another simple query, we can then see how our backups perform over time:

SELECT
  database_name,
  backup_start_date,
  datediff(mi,backup_start_date,backup_finish_date) backup_duration,
  backup_size/(datediff(mi,backup_start_date,backup_finish_date)+1) bytes_per_minute
FROM
  msdb.dbo.backupset

Backup duration is a handy metric for base-lining our systems. After all, if our backups start taking longer and longer, it could be an indication of resource contention. If we’re backing up to local disk, we could be choking our throughput. If we’re backing up to a network share, we could be seeing increased bandwidth usage. Also, our databases could just be getting bigger and might require more resources to support them. By including the backup_size field, we can see if longer backups are the result of simply backing up more data or if there might be something else to it.

If we use the backup_size field and its sibling, the compressed_backup_size field, we can gain some additional insights. Since backups will grow in relation to how much the database grows, this gives us a quick and dirty way to report on those growth patterns. Ideally, you’d want to be track the actual database size, but if you don’t have something to capture that historically, this will work in a pinch. Additionally, by combining it with the compressed backup size, you can get an idea of how much space you’re saving if you use the WITH COMPRESSION option in SQL 2008. A quick gotcha here: This will not show the benefits of compression using third party backup tools. Both fields will show the fully compressed backup size if you’re using something like Red Gate SQL Backup, Quest LiteSpeed, or Idera’s SQL Safe.

Cleaning up after yourself

Now not everything with this table is sunshine and rainbows. Maintaining this history is one of the more commonly overlooked areas of SQL Server administration. Ever wonder why your msdb database keeps growing and growing over time? Bingo, it’s because your backupset table keeps increasing with all the additional history stored inside it. What you want to do is schedule a regular run of sp_delete_backuphistory to keep your history to a relevant period. What that time frame is depends on your database size and needs, though I personally go with 90 days as my default.

Those who don’t learn from history…

Successful database administrators are the ones who make monitoring a part of their practice. With it, we can be proactive with our systems and solve problems before they occur. The great thing about the backupset table is that it’s a very easy way to start checking up on your instances, leveraging information that is already a part of the SQL Server core functionality. You don’t need any fancy tools or complex systems, just a few basic queries to get started understanding how your servers, databases, and systems perform on a day to day basis.