Art of the DBA Rotating Header Image

April, 2011:

Monday Scripts – Getting Partition Information

I’m going to follow up my post on partitioning with a query I wrote while implementing the partitions and cleaning up the empty ones. One of the issues I ran in to was clearly seeing each partition’s range and the number of rows within it. These two questions are answered in different places in the catalog views, sys.partition_range_values and sys.partitions. To build this out, I started with a nice little query from Derek Dieter, adding in a couple joins to get me to sys.partitions. Here’s the result!

select 
	t.name as TableName
	, ps.name as PartitionScheme
	, pf.name as PartitionFunction
	, p.partition_number
	, p.rows
	, case 
		when pf.boundary_value_on_right=1 then 'RIGHT' 
		else 'LEFT' 
	  end [range_type]
	, prv.value [boundary]
from sys.tables t
    join sys.indexes i on t.object_id = i.object_id
    join sys.partition_schemes ps on i.data_space_id = ps.data_space_id
    join sys.partition_functions pf on ps.function_id = pf.function_id
    join sys.partitions p on i.object_id = p.object_id and i.index_id = p.index_id
    join sys.partition_range_values prv on pf.function_id = prv.function_id and p.partition_number = prv.boundary_id
where i.index_id < 2  --So we're only looking at a clustered index or heap, which the table is partitioned on
order by p.partition_number

My Partitioning Odyssey

Recently I had my first real experience with SQL Server partitioning. I had known about it, sure, but most of it was general understanding of the concepts and no real practical experience. Well, all of that changed last month when I successfully partitioned a table with several billion (with a “B”) rows to help get a grip on an application that was slipping out of control. I’d like to walk you through the process to try and help you with any partitioning you intend to do.

That’s no moon!

First off, let’s look at the problem. Like I said, we had a big table, but what does that mean? Well, here’s the hard stats from sp_spaceused:

19,600,710,213 rows
~759 GB reserved space
~432 GB data space
~326 GB index space
~120 MB free space

Yeah, pretty big right? I mean, at 759 GB, this one table was bigger than most databases that I’ve worked with. Structurally, it wasn’t all that complex, though, as it had 3 fields, a composite clustered primary key, and a non-clustered index. However, even with it being very narrow, the size of it prevented us from being able to do any maintenance. And it was almost impossible to properly identify and roll off any data, so our problem was only going to get worse.

How do you eat an elephant?

Based on some of my reading, I was pretty sure partitioning was our way out, but I needed more information. A couple weeks of research later, I came up with the following links that really helped me “get it”:

Partitioned Tables and Indexes in SQL Server 2005
Simple Talk-Partitioned Tables in SQL Server 2005
Kimberly Tripp Web Cast
SQLServerpedia Partitioning article

The first thing I got out of all these articles was why you would want to do partitioning on a table this size:

  • Ability to rebuild/manage indexes as each partition could be rebuild separately.
  • Increased performance for reads based on better data targeting by the query engine, as it should only retrieve needed partitions.
  • Increased performance on all queries, as we would be able to maintain the indexes on the table.
  • Possible performance increase on inserts.
  • Ability to better archive off data as the table grows, thus being able to overall manage space on the server.

So what partitioning gives you is a way to manage the table in small chunks instead as one large object. Or a better way to think of it is the old cliché: How do you eat an elephant?

One bite at a time.

Now, there were also some key ground rules I learned about partitioning:

  • Table partitioning defines how the table will be physically stored
    • If partitioning a heap, then the partition field can be any field in the table since no field is involved in defining how the table is physically stored on disk.
    • If partitioning a table with a clustered index (like a primary key), then the partitioning field must be one of the fields included in the index, as the clustered index defines how the table is physically stored on disk.
  • You are always partitioning by RANGE. If you wish to partition on specific values, then your range declaration will be of that value.
  • Each partition is a physically separate entity, meaning that you can allocate partitions to different file groups within SQL Server. This would be the method of explicitly assigning parts of a table to specific disk locations.
  • SQL 2005 and 2008 are limited to 1000 partitions.

The first point was pivotal for me, as I had seen a bunch of examples where some guys had partitioned on a table field, and some on a clustered index field. Understanding that table partitioning revolves around how the table is physically stored on disk really made it all clear for me.

Planning time!

Armed with this knowledge, it was time to build out my partition structure. The first step was to figure out what I was going to partition on. The table was designed to store a value based on a combination of an individual id, representing a person, and a field id, detailing what type of data was being stored for that individual. Reviewing the ground rules, I knew you could only partition on one field and it must be part of that clustered index, so I was limited to selecting one of those fields. Your partitioning doesn’t have to be the entire clustered index, so using just one of these fields was fine. As the individual id values was pretty granular(about 1.6 billion distinct values), I went with that as my partitioning field.

Next up, I needed to decide on my ranges. The individual id was a numeric, auto-incrementing value, so this made it easy to establish a numeric range. The real question was how large to make each partition, since I wanted them small for manageability, but not to small so I would go over the 1000 partition limit. I ended up deciding on making each partition 5 million distinct individual ID values, which would mean roughly 50 million rows per partition (the individual id to assigned fields ratio was about 1 to 10).

With these two decisions made, I was able to write the following SQL code to create my function, scheme, and table(names have been changed to protect the troublesome):

create partition function pf_bigtable (int)
as range left for values();

declare @boundary int
declare @increment int

set @boundary = 5000000
set @increment = 5000000

while @boundary < 2000000000
begin
	alter partition function pf_bigtable() split range (@boundary)
	set @boundary = @boundary+@increment
end

create partition scheme ps_bigtable
as partition pf_ bigtable
all to ([PRIMARY]);

--Create new table
CREATE TABLE [dbo].[bigtable_p](
	[individualid] [int] NOT NULL,
	[fieldid] [int] NOT NULL,
	[valueid] [int] NOT NULL,
 CONSTRAINT [pk_bigtable_p] PRIMARY KEY CLUSTERED
(
	[individualid] ASC,
	[fieldid] ASC
) ON ps_recipidsv(individualid)
--NC index (created later)
CREATE NONCLUSTERED INDEX [ix] ON [dbo].[bigtable_p]
(
	[fieldid] ASC,
	[valueid] ASC
)

Notice that I used a looping statement to add in all my ranges to save myself the effort of explicitly declaring several hundred partitions.

Getting it in place

The biggest hurdle was partitioning out the table itself. This table was part of an OLTP system that needed to be up almost 24/7. We had a weekly maintenance window of 3 hours one night in the week, but that wasn’t enough time to apply this operation to the live table. Fortunately, we did have plenty of disk space.

What I did was pretty straightforward. I went ahead and created the table with the fully created partition scheme as described above, but empty of data. I also held off creating the non-clustered index. At this point I had an empty copy of my live table. With the help of one of the other guys on my team, we built a batch insert process to step through the live table and insert small batches of records (~6 million at a time) into the partitioned table, so we could build up about 99% of the data from the live table to our partitioned copy. Once we had gotten the bulk of the data inserted, I then created the non-clustered index. When this was completed, we then took the application offline to stop writes to the table, ran a final insert process to get all the new records we had missed since we created the non-clustered index, and then changed the table and index names, swapping the unpartitioned table with the partitioned one.

The initial copy actually took several days to complete, but we were able to have uninterrupted application service during the whole time. When the non-clustered index build was finished, we ended up having only 30 minutes of application downtime to catch everything up and swap the objects.

The finish line

So now that we got all this into place, it was time for us to see what the partitioning bought us. The first item on my list was seeing if I could rebuild the index on the table. By making use of the dm_db_index_physical_stats dynamic management function, I was able to write a script to rebuild each individual partition as necessary:

declare recscan cursor for
SELECT partition_number
FROM sys.dm_db_index_physical_stats (DB_ID(),OBJECT_ID(N'dbo.bigtable'), NULL , NULL, NULL)
where avg_fragmentation_in_percent >= 30;

declare @sql varchar(max)
declare @partnum varchar(10)

open recscan
fetch next from recscan into @partnum
while @@fetch_status = 0
begin
set @sql = 'alter index all on bigtable_p rebuild partition='+@partnum
exec(@sql)
fetch next from recscan into @partnum
end

close recscan
deallocate recscan

The initial run of this still took 8+ hours to complete, so not any real time savings there. However, since most of the table wasn’t getting affected (it was mostly inserts, very few updates), subsequent maintenance only took 5-15 minutes each run because only a handful of partitions actually needed to be addressed.

We also saw dramatic performance in the use of the application. SELECTs of the data were much faster, and the load process that did most of the inserting into the table saw upwards of a 150% speed increase.

Overall, this was a huge win for me and a fantastic learning experience. You can never really put something in your toolbag until you’ve actually been able to do it, and it’s not every day a challenge like this comes your way. However, this experience should also stress the necessity of planning, because we had to jump through a lot of hoops to get the partitions on this table after it had already grown to an unmanageable size. A lot of that effort could have been saved if someone had given some more thought to the amount of data flowing into this system.

Anyway, there’s my partitioning odyssey. I hope this was beneficial to you and if there’s anything that wasn’t clear or may have been missed, don’t hesitate to drop me a note and let me know!
Monday Scripts – xp_logininfo

How many times have you wished you could use SQL Server to query Active Directory and see who is in that group? This week’s script will allow you to do that, so if you have AD groups set up for logging into your server you can see exactly which logins have access.

xp_logininfo is an extended stored procedure that does just that. By passing a couple parameters, you can easily query any AD group that is a server principal. Wrap it up in a dynamic SQL loop, and you can quickly and easily audit your server’s security.

declare @winlogins table
(acct_name sysname,
acct_type varchar(10),
act_priv varchar(10),
login_name sysname,
perm_path sysname)

declare @group sysname

declare recscan cursor for
select name from sys.server_principals
where type = 'G' and name not like 'NT%'

open recscan
fetch next from recscan into @group

while @@FETCH_STATUS = 0
begin
insert into @winlogins
exec xp_logininfo @group,'members'
fetch next from recscan into @group
end
close recscan
deallocate recscan

select
r.name,
u.name,
u.type_desc,
wl.login_name,
wl.acct_type
from (select * from sys.server_principals where type = 'R') r
join sys.server_role_members rm on (r.principal_id = rm.role_principal_id)
join (select * from sys.server_principals where type != 'R') u on rm.member_principal_id = u.principal_id
left join @winlogins wl on u.name = wl.perm_path
order by login_name,r.principal_id,u.type_desc,u.name

Looking at the script, I first do a looped scan through sys.server_principals for all Windows groups (type ‘G’) and collect their AD group info. I store that in a table variable, then join it back to a select from server_principals again for a full listing of all my server permissions. Bam! Instant security report.

Where’d that table go?

The other day I was working with Doug Lane (b|t) over Twitter on an object visibility issue. He was trying to hide objects from linked ODBC selection to a SQL Server, particularly the system views in his database. I was able to help him out, but it got me wondering about exactly what allows you to see objects. I mean, I always knew I could see something if I had SELECT on it, but was that what really controlled the visibility?

I see you!

Seeing a table boils down to being able to view the metadata in the database, which means we must be given the VIEW DEFINITION privilege. This permission was new to 2005, as previous versions of SQL Server would allow any user in the public role to view object metadata. You can GRANT, REVOKE, or DENY this privilege on any of the four levels within SQL Server: server, database, schema, and object. Many actions implicitly grant VIEW DEFINITON, such as granting a user SELECT privileges to a table or EXECUTE on a stored procedure.

Let’s look at a couple examples. I’ll go ahead and create demo_login user on my test instance and add him to my database, but we won’t give him any permissions yet:

use msf_test
create login demo_login with password='dummy';
create user demo_login for login demo_login;

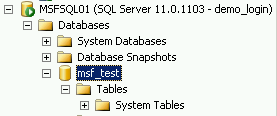
Now, in my test database, I have a table called demo1. My login, demo_login, hasn’t been granted any privileges to this table,so I can’t see the table in my object browser.

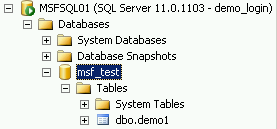
As soon as I grant a permission on it, like SELECT, the table appears:

grant select on demo1 to demo_login;

Again, this is because any GRANT on our table implicitly grants VIEW DEFINITION.

Now just like any any other privilege, we can explicitly DENY that privilege to a user and override (almost) any implicit grant. So, if we want to prevent a user from viewing the metadata on an object, but still allow him to select from it, we simply have to deny him VIEW DEFINITON:

deny view definition on demo1 to demo_login;

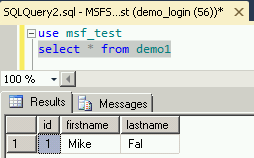
And even though I can’t see the object, I can still query it.

You can’t stop me! I’m invincible!

The caveat to explicitly denying permissions to a user is that three access levels can not be denied view permissions. These levels are:

  • Server sysadmin role
  • The user owns the object in question
  • The database db_owner role (implied ownership of all database objects)

If any of these levels apply, then the user will always be able to see the object. To boot, the system views are a little tricky. I was unable to explicitly deny VIEW DEFINITION to either the INFORMATION_SCHEMA or the sys schemas and prevent them from being visible. This one will take a little more research, but in the interim I know that you can prevent them from being seen in a linked ODBC manager by explicitly denying select on individual system views.

To wrap up, the VIEW DEFINITION is the pivot point of visibility. If you have it, even by accident, you can see that object in any of the methods that list database objects (SSMS object browser, ODBC link manager, etc). There are some tricks to it, but it can be a useful tool if you have specific visibility and permission requirements.

T-SQL Tuesday #17: Using APPLY

I confess, I’m one of those guys who really didn’t know much about APPLY. Sure, I saw it in the occasional query I’d find on the ‘tubes, but I never really dug into what it was and why this piece of syntax was so important. Fortunately, this month’s T-SQL Tuesday has rolled around with an opportunity for me to do a little learning, so off to the Google-mobile!

Of course, you can easily find the MSDN article explaining apply, but there’s a much more detailed one I found on Simple Talk by Robert Sheldon. Conceptually, it’s pretty simple. APPLY, in both its CROSS APPLY and OUTER APPLY forms, allows you to call a table valued function for each row in your data set. In a lot of ways it’s like a join, but instead of two tables linked on a common field, you’re linking your query with a computed set of rows that you return with your function.

Now, I wish I could say I had some cool query to share, but tend to use APPLY in some simple ways to get query information. Here’s a query that makes use of the dynamic management functions dm_exec_query_plan and dm_exec_sql_text that gets a lot of work from me:

select
	er.session_id,
	d.name database_name,
	er.status,
	er.wait_type,
	eqp.query_plan,
	est.text
from sys.dm_exec_requests er
	join sys.databases d on (er.database_id = d.database_id)
	CROSS APPLY sys.dm_exec_query_plan(er.plan_handle) eqp
	CROSS APPLY sys.dm_exec_sql_text(er.sql_handle) est

Using this, you can get your text and your query plan for all queries currently running on your server. I like to use the query plans to troubleshoot long running queries, and the wait types help you identify the queries you might want to look at first.

Enjoy the other T-SQL Tuesday posts out there and huge thanks to Matt Velic(blog|twitter) for hosting this month!

Monday Scripts – Free Space by Drive

Here’s a quick script that will allow you to gather up your free space by drive on your server. You can use this to evaluate your space usage and address immediate concerns. It’s a straightforward query that uses dynamic SQL to query the files in each database’s sys.database_files view and the SpaceUsed property collected by the FILEPROPERTY function.

declare @return table
(drive_letter varchar(100),
 allocated_space decimal(15,2),
 used_space decimal(15,2),
 free_space decimal(15,2))

declare recscan cursor for
select name from sys.databases
where state = 0

declare @db varchar(100)
declare @sql varchar(max)

open recscan
fetch next from recscan into @db

while @@FETCH_STATUS = 0
begin
	set @sql = 	'use ['+@db+'] '+
				'SELECT	UPPER(SUBSTRING(filename,1,2)) ,'+
				'sum(a.Size)/128.0,'+
				'sum(FILEPROPERTY(a.Name,''SpaceUsed''))/128.0,'+
				'sum(a.Size-FILEPROPERTY(a.Name,''SpaceUsed''))/128.0'+
				'FROM ['+@db+'].dbo.sysfiles a ' +
				'GROUP BY SUBSTRING(filename,1,2)'
	insert @return
	exec(@sql)

	fetch next from recscan into @db
end

close recscan
deallocate recscan

select
	drive_letter,
	sum(allocated_space) total_alocated,
	sum(used_space) total_used,
	sum(free_space) total_free,
	sum(free_space)/sum(allocated_space) perc_free
from @return
group by drive_letter
order by drive_letter

The main trick of this and the reason why we can’t use sys.master_files is because FILEPROPERTY only provides data for the current database context. If you try to call FILEPROPERTY for a file not in your current database, it will return a NULL.  As a result, we need to dynamically switch database contexts and gather the data for all of our databases.

Parallelism, SQL Server, and you: Round 2

Previously on Art of the DBA: The basics of parallelism.

Control! You must learn control!

So now that we’ve gotten the basics of  parallelism under our belt, it’s time to see how SQL Server uses it. The bad news is that most of the decision making about using parallelism is made by the black box known as the query optimizer. However, there are two parameters in the SQL Engine that we can manipulate to control whether or not a query will be parallelized, both managed in the server configuration.

The first option we can adjust is the cost threshold for parallelism.  Generally speaking, this is the value that SQL Server looks at when evaluating the cost of a query. If the query exceeds that cost, it will be parallelized. Otherwise, it will be run as a single threaded operation. Query cost is the estimated number of seconds a query will run in a single thread and to get an idea of what your query cost is, check your query execution plan. The default value for the cost threshold parameter is 5, so if a query is estimated to take longer than 5 seconds, SQL Server will parallelize it.

The second option is Max Degree of Parallelism, commonly referred to as MAXDOP. This defines the maximum number of threads a parallel query will be given.  The default value for MAXDOP is defaulted to 0, meaning  SQL Server will not limit the number of parallel threads it will create for a query, but it’s usually not the best option. You can find a lot of documentation out on the ‘tubes concerning MAXDOP, but the general rule of thumb is to set it to half the number of processor cores you have, up to 8.

The nice thing about MAXDOP is you can also use it as a query hint.  Using it, you can alter the degree of parallelism for your specific query and not have to worry about mucking with the server setting. Usually you’ll want to make use of this hint to set your max parallelism to 1 if you’re running a long running background task, like maintenance, and you don’t want it to interfere with your normal workload.

Decision Time

Knowing all this, how do we adjust our SQL Server to get the best use out of parallelism? The key is understanding which workloads take advantage of parallelism and which don’t. The first step is figuring out whether your server is an Online Transactional Processing (OLTP) server or a Decision Support System(DSS).

A DSS server, also known as a data warehouse, will benefit most from parallelism. Since your server will usually have a limited number of reporting queries with large datasets, you’ll want that workload spread out to get it processed faster. Also, because you’re dealing with data that is relatively static (it really only changes when you’re processing your warehouse loads), you’re not concerned with holding any locks on your databases, nor do you need to worry about preventing or delaying any data changes from happening while your parallel queries are running.  So parallelism is ideal for devoting as much horsepower to each query as possible.

This is also why parallelism is not a good choice for OLTP systems. Remember, when a CPU execution unit is working on a thread for your query, it won’t be working on anything else. This means that you could be queuing up and delaying important transactions waiting on parallel queries to complete. Since your OLTP system will usually be expected to be processing a lot of small transactions very quickly, a couple parallel queries could really bottleneck your system.  Instead, you want to make as many threads available to your processes as possible and not limit the number of processes you can handle at one time.  This is why you will usually see recommendations for low MAXDOP settings for OLTP, so you can make more CPU execution units available to your total transaction load.

When all is said and done, managing your MAXDOP and cost of parallelism settings are very much part of the DBA art form, where you will need to test and evaluate your workload to find the settings that are appropriate for your server. Here’s a couple steps to get started with on your server:

  1. What kind of queries and how many transactions does my server see? Talk to your developers about the processes and take a look at your Batch Requests/second perfmon counter to help you evaluate this.
  2. Check your current MAXDOP and cost of parallelism settings on your server.  Are they set to the defaults?
  3. What do your CXPACKET waits look like relative to other waits on your server? High CXPACKET waits might be an indication that the MAXDOP on your server is set to high.  To find out your waits, Glenn Berry has an excellent DMV query within his SQL Server 2008 Diagnostic Information Queries that will provide this information for you.

Once you have this information, you can make a plan to adjust your parallelism settings, but you’ll need to test any changes to your settings before implementing them.

Parallelism, while it may not have a tremendous impact on your system, is an important factor nonetheless. Understanding and making proper use of it will help you manage and improve performance on your server.  As an editorial note, I would like to see SQL Server give you some more fine grained control over parallelism, like Oracle does in their query hints.  Hopefully we’ll get to see that in a future release.

Thanks for reading and feel free to leave comments or questions below!

Parallelism, SQL Server, and you: Part 1

In today’s computing world, it usually doesn’t take long before you hear the word “parallelism”, certainly if you’re a SQL Server DBA. As servers now support more and more processors, the modern database application needs to be able to take advantage of parallel processing for query processing. This two part post should give you a good foundation on what parallelism is and how SQL Server makes use of it.

What is Parallelism?

To really understand what parallelism is, first we need to talk a bit about processor architecture. The CPU on any machine is a one-man band. It’s constantly working on all the different tasks the computer sends to it. However, that little machine has a big limitation: It can only do one thing at a time. Granted, it can do that one thing very quickly and very well, but the CPU must finish each individual task before it can move on to the next. This is where we get the processor queue. The CPU takes each task that is sent to it and puts it into a list. As each task is completed, it will go to this list to get the next job it needs to do.

Obviously, this can be a pretty big bottleneck on your system. So manufacturers started adding additional processors to servers to spread the workload out. Then, if you had 2 processors in a machine, you now had 2 workers that can get tasks done, 4 processors to give you 4 workers, and so on. Of course, you could quickly run out of physical space on a motherboard for all these processers, so then came the introduction of multi-core processors, helping to expand this even further and providing even more execution units for our workload.

Parallelism is born out of taking advantage of these multiple workers. Normally, an entire SQL query and the work associated with it would be assigned to a single processing core. On a machine with one or two cores this might not be a huge impact, but if your server has 16 available cores, you’ll have a lot of lost work time as cores sit idle. What SQL Server does is take your query and break it up into smaller workloads, distributing those workloads across the available cores, and then consolidating the results as each workload, or thread, completes. So parallelism is, simply put, doing a task in parallel.

While there’s a lot more involved here, the full detail of CPU architecture and how SQL server takes advantage of it, you should check out Chapter 5 in the excellent Professional SQL Server 2008 Internals and Troubleshooting.

Seeing Parallelism In Action

So how can we find parallel queries on our server? If you want to use the GUI, you can just pull up the Activity Monitor, open up processes, and look for any process ID that has multiple rows, as each row represents a different thread of work. However, the quickest way is to query the DMVs:

select
 er.session_id,
 er.status,
 er.command,
 er.blocking_session_id,
 er.wait_type,
 ot.exec_context_id,
 ot.task_state,
 st.text
from
 sys.dm_exec_requests er
 join sys.dm_os_tasks ot on (er.session_id = ot.session_id)
 cross apply sys.dm_exec_sql_text(er.sql_handle) st
where er.session_id in
 (select session_id
 from sys.dm_os_tasks
group by session_id
having count(exec_context_id)>1)

sys.dm_os_tasks is the key view here, as it will show you each individual thread that SQL Server is making use of. I then join to sys.dm_exec_requests and sys.dm_exec_sql_text for additional information on the processes.

And I’m still waiting!

One thing you will probably see a lot of when your server has a lot of parallelism is the infamous CXPACKET wait. When SQL Server breaks up a query for parallel processing, the optimizer tries to balance the workload as best as possible, but you will almost always have a case where some threads will finish ahead of the rest of the job. This is where CXPACKET shows up, because the query is waiting on the remaining threads to complete before it can consolidate the results and resolve the entire process.

The issue with CXPACKET is that it’s not always indicative of a problem. In a lot of ways, it’s very much business as usual, as it will always show up when you have parallelism. The key is trying to identify when it’s happening to much, the result of you over parallelizing your workload.

We’ll go over this in part two, as we look at how we can control parallelism in SQL Server and how different workloads make use of parallelism. Hope to see you then!

Meme Monday: SQL Server in 11 words

Stopped SQL during rollback, waited on recovery, and watched rollback again.

This is how I learned a fair amount about SQL Server and how it handles rollback.  The team I was on was working on a database with a huge table.  We’re talking billions of rows here huge.  Unfortunately, due to design and the growth of this table, it was all in a single partition.  And we were kind of stuck with it.

The biggest problem with this table was maintenance.  Sure, we could update statistics, but we couldn’t rebuild the index.  There simply wasn’t enough space on disk for the rebuild to happen.  How did we find this out?  Because the disk filled up in the middle of the job, causing it to fail and go in to rollback.

There we were, looking at a 14-hour rollback.  While the database was still functional, this table and all related tasks were blocked.  The smart thing to do was to wait it out and let SQL sort through the transactions.  Still, it’s easy to get a little antsy looking at that long of a rollback.  We decided that we could go ahead and bounce the SQL Service, causing SQL to go into recovery of all the committed work (i.e., BEFORE the reindex job died), but not process any of the uncommitted transactions.  Sure, we’d have to wait on recovery, but that couldn’t be as long as the rollback, right?

Well, not really.

The instance went into recovery, as expected, and didn’t take quite as long as the 14 hour rollback, but it still took a while.  After all, we were in full recovery mode and the transaction logs were still pretty sizable.  However, once it got done, we saw that the table was still locked.  It confused the heck out of us, because we didn’t see any processes locking the object when we ran sp_who2.  That is, we didn’t see any user processes.

You guessed it.  When we looked at the system processes, there was the locking processes.  SQL Server was still dealing with the rollback, it was just doing it under the covers as part of the recovery process.  That’s the other thing, this was all part of fast recovery, which is SQL Server allowing access to the database while it’s still finishing up it’s recovery processes after a crash.  Because even while some of those transactions may not have been committed, SQL Server still needs to sort through the chain and resolve the transactions in the log.  Including the one it was rolling back.

So Moral of the Story?  Let SQL Server do it’s thing when handling transactions.  Yeah, things may suck, but many times there’s not much you can do but wait it out.   There’s a reason these mechanisms are in place, so let the engine work.

Sorry there’s no script today, but thanks for joining me for Meme Monday.  It’s the brainchild of Tom Larock, the SQL Rockstar(blog|twitter), but I’m not tagging him.  Yet.  :)  However, I am going to tag three other bloggers I know:

Stop by their blogs and (hopefully) see their contributions.  Or just read their blogs and enjoy the knowledge!

Dumb Questions

“Can I ask a dumb question?”

Anyone who works with me for a short period of time will hear this tumble out of my mouth.  I can’t tell you the number of times someone launches into a 5-10 minute explanation of a really cool concept and giving me that “I have a cunning plan” look when they finish.  However, because I didn’t have that one thing in my head they figured was obvious, I end up having to ask a couple questions to get myself on the same page.  It’s never a big deal to fill in those gaps and the opposite party is usually happy to provide the context, but I do have to ask those questions.

Assumption: The Mother of all Screwups

The problem is with assumptions.  Whenever we communicate with each other, we have to make an assumption about what the other person knows.  Unfortunately, a lot of times those assumptions are wrong.  Remember the ill-fated Mars orbiter where there was a mixup between the imperial and metric measurement systems?  While we all smack our forehead and say “D’OH”, it’s pretty obvious that this is the result of one side making assumptions about the other side’s knowledge.  If someone had questioned the basic assumptions of both sides, they might have saved that $125 million orbiter, but instead, the two teams ran off on different tracks because they didn’t want to appear dumb.  (How how do they look now, right?)

I know we all get frustrated when the Level 1 support tech asks us if our network cable is plugged in or that we haven’t kicked out the power cable, but these are exactly the kind of questions we need to ask when troubleshooting database problems or building requirements for a project.  The reason for this is because asking the dumb questions helps establish a baseline starting point for figuring out the problem.  After all, when someone comes to us saying “the system is slow”, we don’t want to bash our heads with IO stats or memory pressure when all we had to do was deal with one blocking query.  We wouldn’t know about that unless we asked the right questions to start our troubleshooting.

So tell me a little about yourself

The best approach is to dealing with this is to teach yourself to reduce the number of assumptions you make.  Easier said than done, right?  What really helped me was an exercise a former boss/mentor had me do early on in my career.  It’s pretty simple:  In one paragraph (no real limit on sentences or words), describe your work to someone who has no idea what you do.

Seems easy at first, but think about it for a second.  Let’s break down the following sentence that I might use:
“I administer and maintain SQL Server databases.”

Already in this sentence we have several assumptions about the listener.  First, that they know what a database is, and they know what maintenance and administration is for SQL Server.  Chances are most folks don’t, so we would then have to explain those terms to them in a way they would understand.  We don’t need to get overly complex, but provide the listener a basic grasp of what we’re talking about.

The end result is that this exercise puts us in the mindset of someone who may not have the same knowledge or experience as we have, thus getting us to restructure our thinking and presentation in a way that covers the entire context of whatever idea we’re presenting.  It also gets us to start evaluating our assumptions based on our audience.  We’re always going to make assumptions, but what we want to do is make them in the context of our audience.  Speaking to a group of DBAs?  Yeah, leave out that stuff about relational theory.  Talking with IT infrastructure dudes?  Chat with them a bit about database file layouts and managing I/O contention.  Oh, monkeys from Kenya?  Throw ’em a couple of bananas.

Duh!

So whether we’re asking ourselves or someone talking to us, it’s always good to get those assumptions straight.  Sure, we all pride ourselves on figuring things out.   That’s why we’re in this business, for the joy of solving that process that no one else could.  But it never helps us when we get lost on that wild goose chase because we made the wrong assumption.  Save yourself some time and a lot of headache, make sure you’re on the same page with those you work with, and ask some “dumb” questions.  It never hurts.