Art of the DBA Rotating Header Image

June, 2012:

A short ride on a PoSH machine

I want to talk about one line of code.  Ok, well, two lines of code, but the first line isn’t that important, much like the opening act of a rock concert.  Let’s just pretend that the first line, while necessary, just gets us warmed up for the main event.

My problem was this:  I was collecting a SQL Server inventory but couldn’t retrieve all the information I was looking for.  I had started with some of the elements of Allen White’s(b|tscript as well as what Collen Morrow(b|t) assembled, but I was still missing the TCP/IP address and SQL port.  In my shop we use static addresses and I wanted to have that information handy.  So, to the Google-mobile.

My searching led me to a Sean McCown(b|t) video that showed me how to grab the TCP/IP address, so I was halfway home.  However, I just couldn’t find a clear way to grab the port information.  I think I was stretching my fingers to start pulling my hair out when I bumbled into the ManagedComputer class in the SMO.  Down the rabbit hole I went, using Get-Member, and eventually came up with this:

$managedcomp = new-object ('Microsoft.SqlServer.Management.Smo.WMI.ManagedComputer') $sname
$port=$managedcomp.ServerInstances[$iname].ServerProtocols["Tcp"].IPAddresses["IPAll"].IPAddressProperties["TcpPort"].Value

Hopefully that doesn’t look to intimidating, but let’s break it down a bit.  The ManagedComputer class (in this case $managedcomp) represents the physical host for the machine.  Using this, we can then access the various properties of that.  In succession, we have:

  • ServerInstances – An array of all the named instances installed on the machine.  I’m passing a variable to this, which happens to be the name of the instance I want the port for.
  • ServerProtocols – An array of the different protocols, so in this case we want the TCP/IP protocols.
  • IPAddresses – Note, these are the different address configurations SQL is listening on, but it’s what appears in the SQL Server configuration tool.  Your array elements are named IPN or IPAll (if it applies to everything).  Since I’m looking for the port that is assigned for all my addresses, I’ll look at the IPAll object.
  • IPAddressProperties – Simple enough, the properties of the IPAddress object, and we want the TcpPort property specifically and its value.

How did I get here?  Making extensive use of Get-Member.  Much like Theseus in the Labyrinth, I used that to figure out where to go next each time I went to a deeper property level.

And this is what I hope people take away from this.  There’s so much information buried in the .Net objects that we can take advantage of, especially by using Powershell.  I’ll be the first to admit that there might be a better way to do this(please tell me if there is).  This shows, though, that by using the tools in front of me, I was able to expose the secrets of this particular set of objects and bend them to my will.


P.S.  For those interested, I’ll post the full server inventory script here in the near future.
Process of Elimination

I never expected to talk as much about partitioning as I have so far this year. The tally is currently at six, with at least two more in the works. It’s a hot topic due to partitioning still being a mystery to a lot of folks and I’m glad I’ve been able to pull back the curtain a little bit.  However, there’s still some things not understood very well.

One of these is partition elimination. Heck, up until I really started studying partitioning, I didn’t understand it very well either. Just like many others out there, I thought that once you partitioned a table, all your queries would suddenly become faster because the engine would only look at the needed partitions. While SQL Server tries to do this, the reality of when partition elimination actually occurs is not quite as cool.

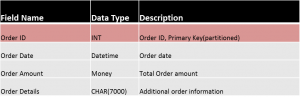
To figure out how partition elimination works, we only have to look at our query plans. Let’s crack open the demo I use in my partitioning presentation and take a look. As a quick recap, I use a basic orders table that is partitioned on an incrementing integer primary key:

Now let’s run a simple SELECT to query data out and capture the query plan that results:

select * from orders
where order_id between 11000 and 15000

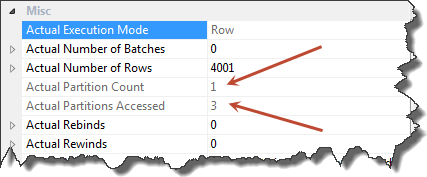
Nothing complex here and nothing complex in the query plan. You’ll see the expected clustered index seek. What’s key is to look at the properties (F4) of your operator to see how your partitions are being used:

These two property values give us all the answers when it comes to partition elimination. First, Partition Count tells us that the engine only retrieved a single partition for our query. Actual Partitions gives us the partitions (in this case, partition 3) that were actually accessed. Great! In this case, by querying order_id, we were able to take advantage of our partitioning.

What if we use a different field, will SQL still try to take advantage of the partitioning? It depends on whether or not the partitioning key is used in any part of the query. We’ll go ahead and add an index on order_date (which will be partitioned aligned) and query to get the total order amount for date range:

select sum(order_amount)
from orders
where order_date between '1/1/2012' and '2/1/2012'

Now, this plan is a little more interesting, so let’s take a look at it, focusing on the two places where we hit the table:

You’ll note that the query has to use a key lookup to complete the query. This is because we have an index on order_date, but it doesn’t include the order amount, so the engine has to go back to the table using the clustered index to find our data. Let’s now look at the properties for each of these operators:

Where are the partition properties for the index seek? Since the query can’t make use of partitioning for this part of the query, the properties aren’t listed. However, the key lookup (which makes use of the clustered index and, therefore, our partitioning scheme) does show that we accessed only partition number 3.

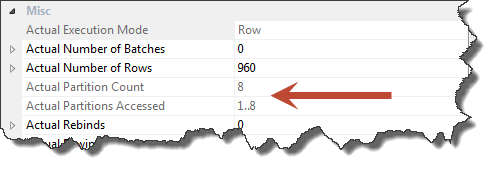
What if we go a step further and alter our index on order_date to include order_amount, removing the need to do a key lookup in the query? Let’s take a look:

By detailing that the query accessed eight partitions (1..8), we see that the engine tried to use the partitioning.  Since the partitioning key wasn’t directly involved, it ended up seeking across the entire index anyway.

To wrap it all up, let’s look at the performance of our order_amount queries:

  • Query cost on index without include: 2.63403
  • Query cost on index with include: 0.0276018

So even without using our partitioning, including the order_amount is still much faster than having to do a key lookup.

Overall, partition elimination can be a helpful tool in the engine’s toolbox. As your data sets get larger and larger, it can improve your performance, but only if you understand how the engine uses partitions. Sometimes, however, it’s better to take a different approach.  Don’t go and rewrite all your queries simply to get your partitioning key involved, because it may not help. Always do a careful analysis of what’s going on under the covers before making any tuning decisions.

T-SQL Tuesday #31: Logtime (#tsql2sday)

This month’s T-SQL Tuesday is hosted by Aaron Nelson(b|t), asking participants to talk a little about logging. Now there are plenty of technical operations and other logging tricks we could talk about, but Aaron’s request is a broad one and we have the opportunity to cover other forms of logging. So while I could talk about writing out text logs of Powershell actions or parsing and maintaining the various logs within SQL Server, I want to talk about a different kind of logging: time tracking my day.

Time tracking is one of those annoying administrative aspects of our job, much like documentation and project planning. While these tasks can be overdone, they’re all necessary for making our job more efficient and manageable (when done right, of course). The thing about time tracking is it’s hard to really understand where we spend our day when we’re in the trenches fighting fires. When we look back on our week, can we say that we mostly did client work? Administrative tasks? Maintenance jobs? And when we go to our boss and say “Hey, I can’t get this project done because I’m swamped doing ______”, how do we prove our case?

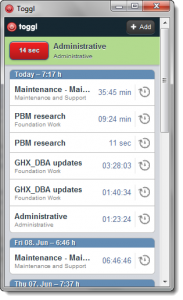
Now the problem with time tracking is it can be really tedious. We’re very much limited by the tools we have. This is why I was thrilled when I was reading a post by Kendra Little(b|t) about a great tool called Toggl. This handy application is a blessing. It has a simple to manage interface(either by using the web interface, mobile application, or desktop client) with a timer, where a simple click can either start a new task or continue something else you were working on. Because I can create time entries with a click or two (maybe some typing if I’m creating a new entry), tracking my time becomes less tedious and doesn’t intrude much on my day to day work.

Toggl Desktop

Also easy to manage in the interface is grouping tasks in to projects. Because the interface is so simple, I can create a project on the fly. Mostly, it’s just a description in the application, but it helps me group the individual tasks together. Personally, I have four projects: Client Work, Foundation Projects (internal work), Maintenance (break/fix activities), and Administrative. What you might have will vary, but this break down works well for me. The interface makes it very simple to assign a new task to one of these projects or create a new project.

Of course, we all know that while this may be easy to create at entry time, there’s always going to be some cleanup. Whether a misspelled project, an erroneous time entry, or just forgetting to enter a record, there will be times we’ll need to go back and correct things. Again, the application allows for simple lookups of our records as well as easy modification. I can use this to either update or add new records when I’ve missed something.

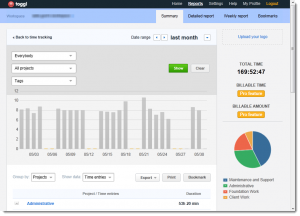
The beauty of this tool, however, is in the reporting. By including some simple bar graphs, pie charts, and date ranges, I can quickly see how my time breaks down. To me, this is the most important part, because then I can see if I really am spending too much time on meetings and other administrivia (I try to keep it to about 25% of my total time). Also, if my maintenance time is high, it probably means that we have some systemic issues that should be addressed. The nice thing is I can show interested parties how my time is being utilized at a glance with minimal interaction on my part.

The biggest benefit of this tool is that I tremendously reduce the effort I need for time tracking. I would easily spend one to two hours a week trying to track my time and log it properly. While this may not seem like much, it starts to eat in to everything when you start including that into time spent in meetings and similar administrative work. Also, let’s be honest, that’s time I could be spent writing a new script or solving a cool problem. With Toggl, I now only need about 15 minutes of the work week for time tracking.

Toggle has been a boon to me, but I wouldn’t have it without reading some of the great SQL bloggers out there. Thanks again to Kendra for cluing me in to this application, and thanks to Aaron for giving me the opportunity to write about it. I’m going to definitely be checking out some of the other T-SQL Tuesday posts in this series to see what other time save tips, tools, and tricks I can leverage to make my life easier.

Because, in the end, isn’t it all about making my life (and yours) easier?